Risk Management Tools
Calculation techniques
There are plenty of approaches to the calculation of VaR and related measures. The methods that are implemented in SmartFolio are described below.
The last four methods utilize block bootstrapping algorithm.
Delta-Normal Method
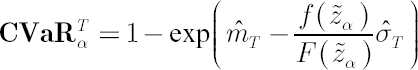
This method is simplest and the most common in application. Based on the analytical model assumptions, it calculates  -quantile -quantile  of the normal distribution with parameters of the normal distribution with parameters 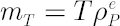 and and 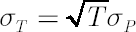 . .
It corresponds to the distribution of portfolio excess growth rate equal to  , where , where  denotes the discounted portfolio wealth at time denotes the discounted portfolio wealth at time  . .  is then calculated as is then calculated as 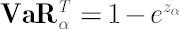 . .
Accordingly,
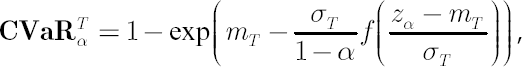
where  denotes the density function of the standard normal distribution. denotes the density function of the standard normal distribution.
Unfortunately, Delta-Normal Method (DNM) is far form being precise. The main drawback of DNM is that it doesn’t take into account higher moments of the portfolio returns distribution including fat tails, which are
very common in practice and have critical impact on VaR-CVaR values.
Another possible shortcoming of DNM is the assumption that portfolio returns are independent through time.
It leads to the so-called square-root scaling law for standard deviation, which means that 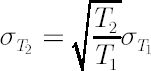 . .
In practice it is often the case that instead of square root degree,  should be used. should be used.
Final DNM weakness is its inability to account for non-linear relationships between portfolio components, which arise when options are included in portfolio.
As a consequence, quite often DNM seriously underestimates true values for VaR and CVaR, particularly for the extreme values of  , exceeding 0.95. , exceeding 0.95.
Empirical Distribution
Empirical Distribution approach involves the following steps:
- The array of historical portfolio excess logarithmic returns over the period
 to to  is formed. If contains more then one period, then prior implementation of block bootstrapping algorithm must is formed. If contains more then one period, then prior implementation of block bootstrapping algorithm must
increase accuracy.
- The obtained array is sorted and the worst
 values are extracted. values are extracted.
- The best and the average values of the selected worst part are calculated.
- VaR and CVaR are then obtained by transformation of respective values to represent simple returns with the opposite sign using
 relationship. relationship.
If homogeneous historical data of virtually unlimited length was available, then the empirical distribution approach would be ideally suited for the calculation of VaR and CVaR. It accounts for both higher moments
of portfolio returns distribution and non-linear interdependencies. In reality its use is limited to portfolios, whose components are traded for time long enough (at least, 5-7 years for daily database).
Implied Normal Distribution
Delta-normal method utilizes the assumption of square-root growth in portfolio standard deviation  as a function of . On the contrary, implied normal distribution approach uses the unique estimate of as a function of . On the contrary, implied normal distribution approach uses the unique estimate of
for each value of . For this purpose, analogously to empirical distribution approach, the array of historical excess logarithmic returns over the period  is formed using block bootstrapping algorithm. Then the sample estimate is formed using block bootstrapping algorithm. Then the sample estimate  is obtained and inserted in formulas for delta-normal method. is obtained and inserted in formulas for delta-normal method.
While the implied normal distribution approach doesn’t assume the square-root scaling law in standard deviation, it still suffers from two residuary drawbacks, peculiar to delta-normal method: the inability to
account for higher moments of portfolio returns distribution and the non-linear relationships among portfolio components.
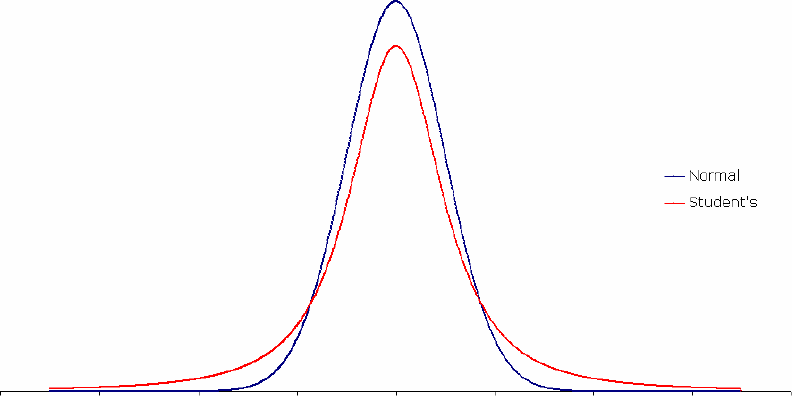
Student’s t-Distribution
There is much evidence, coming from recent publications in financial math, that Student’s t-distribution delivers quite satisfactory fit to a wide range of financial assets including stocks, commodities and
currencies. Its attractive feature is a power law of tails behavior, which makes t-distribution an appealing alternative to normal distribution thanks to positive kurtosis excess.
Figure 2. Student’s density vs. Normal density
As before, the VaR-CVaR calculation is anticipated with formation of an array of historical excess logarithmic returns over the period by means of block bootstrapping algorithm.
Analytical formulas for VaR and CVaR under the assumption of non-central Student’s t-distribution with possibly non-integer degrees of freedom are obtained in [Andreev, Kanto; 2004]. Corresponding density
function is defined by the following expression:
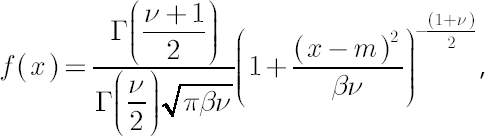
where  is location parameter, is location parameter,  is dispersion parameter and is dispersion parameter and  denotes degrees of freedom. denotes degrees of freedom.
In this case quantity is directly related to kurtosis. Corresponding estimate  has the following form: has the following form:
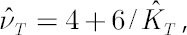
where  is the sample estimate for kurtosis excess (it is assumed that is the sample estimate for kurtosis excess (it is assumed that  ). Corresponding estimates for and are ). Corresponding estimates for and are 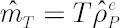 and and 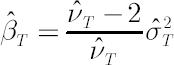 respectively. respectively.
Then  , where , where  and and  stands for inverse Student’s t-distribution function with parameters , stands for inverse Student’s t-distribution function with parameters ,  and and  . Accordingly . Accordingly  , where , where

In the latter expression  denotes Student’s t-distribution density function and denotes Student’s t-distribution density function and  . .
Cornish-Fisher Expansion
Cornish-Fisher Expansion approximates the quantiles of an arbitrary distribution with known moments in terms of quantiles of the standard normal distribution.1 The main advantages of applying Cornish-Fisher
expansion in calculation of VaR-CVaR are speed and ability to account not only for fat tails as Student’s t-distribution does, but also for asymmetry in returns, measured with skewness.
Algorithm
- An array of historical excess logarithmic returns over the period
 is created by means of block bootstrapping algorithm. is created by means of block bootstrapping algorithm.
- Based on the obtained array four moments are estimated: sample mean , sample standard deviation
 , sample skewness , sample skewness  and sample kurtosis excess and sample kurtosis excess  . .
- Let
 denote denote  -quantile of standard normal distribution. -quantile -quantile of standard normal distribution. -quantile  , corrected for kurtosis and skewness, is established by means of Cornish-Fisher expansion up to 4-th member (for details see [Zangari; 1996]) : , corrected for kurtosis and skewness, is established by means of Cornish-Fisher expansion up to 4-th member (for details see [Zangari; 1996]) :
  , where , where  and and  are the standard normal density and distribution function respectively. are the standard normal density and distribution function respectively.
1 For more details about Cornish-Fisher expansion visit http://www.riskglossary.com/link/cornish_fisher.htm
| |
|
 SiteMap\
 Contact Us
 The Theory
\
Details
\
risk management tools
\
calculation techniques
The Theory
\
Details
\
risk management tools
\
calculation techniques