 SiteMap\
 Contact Us
 The Theory
\
Details
\
appendices
\
appendix C
The Theory
\
Details
\
appendices
\
appendix C
   Introduction
Details
    |
Appendices
Appendix C. Investments ranking and Performance measures
Most of the existing measures, destined to evaluate performance of a portfolio or an individual asset, have the form of Risk-to-Reward ratio. They differentiate depending on particular definitions of Risk and Reward. | ||||||||||||||||||||||||
| Reward | ||
|---|---|---|
| Risk | Expected excess growth rate | Excess Mu |
| Volatility | Information Ratio | Instantaneous Information Ratio |
| Downside Volatility | Sortino Ratio | Instantaneous Sortino Ratio |
| Normalized Downside Volatility | Normalized Sortino Ratio | Normalized Instantaneous Sortino Ratio |
| Conditional Value-at-Risk | STARR Ratio | Instantaneous STARR Ratio |
| Normalized Conditional Valueat- Risk |
Normalized STARR Ratio | Normalized Instantaneous STARR Ratio |
Fix some minimum acceptance excess rate
Information Ratio
Definition. Information Ratio
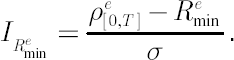
Note. Widely recognized Sharpe Ratio is a particular case of information ratio corresponding to
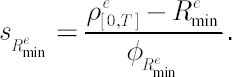
Sortino Ratio
Definition. Sortino Ratio
Normalized Sortino Ratio
Definition. Normalized Sortino Ratio, corresponding to
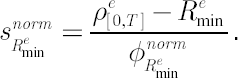
Under the assumptions of the analytical model, the normalized Sortino ratio coincides with information ratio.
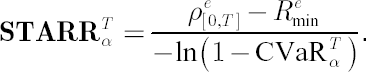
STARR Ratio
Definition. STARR Ratio is equal to the difference between expected excess growth rate
Normalized STARR Ratio
Definition. Normalized STARR Ratio (NSTARR) is the STARR ratio, corrected in such a way that in case of normally distributed logarithmic returns it coincides with information ratio.

where
Definition. Normalized CVaR is a measure, based on CVaR, corrected in such a way that under the assumptions of the analytical model it coincides with volatility measure.
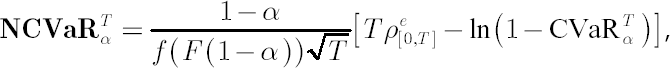
where
Under the assumptions of the analytical model, all above performance measures are equivalent when used to sort the list of available portfolios according to their investment attractiveness. Otherwise, because of the
properties of downside volatility and CVaR respectively, the Sortino Ratio and the STARR ratio might become more relevant measures of performance.
Standard performance measures vs. their instantaneous counterparts
Below we focus on the Sharpe ratio, but the same logic holds true for all other performance measures, presented above.
Definition. Sharpe Ratio

Definition. Instantaneous Sharpe Ratio

Both the Sharpe ratio and the instantaneous Sharpe ratio sort assets according to their relative performance in the past. However, there is an essential distinction in the information the corresponding rankings reflect.
- If compared assets are supposed to be used as components of a continuously rebalanced portfolio, then the instantaneous Sharpe ratio becomes more appropriate performance measure.
- If one compares already formed portfolios, rather than separate assets, then their relative investment appeal should be measured with the Sharpe ratio.
as separate alternative investments, thus depriving the investor of the continuous rebalancing advantages. For further details see [Nielsen, Vassalou; 2004].
