![]()
The Black-Litterman model provides a framework for incorporating subjective investor's views on future realized returns into the process of portfolio construction. The model blends expected returns implied by market equilibrium with investors views. Typical views have the following form (taken from [Idzorek; 2004]):
View 1: International Developed Equity will have an absolute excess return of 5.25% (Confidence of View = 25%);
View 2: International Bonds will outperform US Bonds by 25 basis points (Confidence of View = 50%);
View 3: US Large Growth and US Small Growth will outperform US Large Value and US Small Value by 2% (Confidence of View = 65%).
The first view is an absolute view, while two others are relative views.
SmartFolio implementation of the Black-Litterman framework consists of the following steps:
Input market capitalization weights into the Market Cap column. During the portfolio construction process this range is filled with default values taken from the corresponding field in the database.
Set market risk aversion. According to research articles this number is roughly equal to 3.
Define views matrix, each column of which consists of asset weights for a particular view. For example, view 1 above corresponds to the column of zeros with 1 at the position corresponding to International Developed Equity.
Set expected excess returns for each view in the Excess Mu range.
Define views confidence level(s). Depending on the choice made in the Black-Litterman Options dialog confidence will be set for each view individually or will be determined with one global confidence level applied to all views simultaneously.
Click the Calculate! button to perform model calculations.
 Note. The covariance matrix used in the Black-Litterman
formulas is taken from the Model
table.
Note. The covariance matrix used in the Black-Litterman
formulas is taken from the Model
table.
The main result generated is a vector of posterior expected excess returns presented in the Posterior Excess Mu field.
Apply posterior expected excess returns to the analytical model The financial market model which assumes that all assets collectively follow a random walk in continuous time. This means that distribution of logarithmic returns is normal, returns are serially uncorrelated, and variance of returns grows linearly with a time interval under consideration. by clicking the Send button. Risk-free rate Fixed continuously compounded interest rate paid on the Riskless asset. The same as Dividend yield in the riskless asset. will be added to each of the Posterior Excess Mu values, and the resultant vector will be copied to the Mu field of the Model table.
For further details on the Black-Litterman model please refer to [Idzorek; 2004] and [Walters; 2008]. Both articles are very intuitive and are highly recommended for reading.
The screenshot of the Black-Litterman table with a sample analysis replicating the example from [Idzorek; 2004], is presented below.
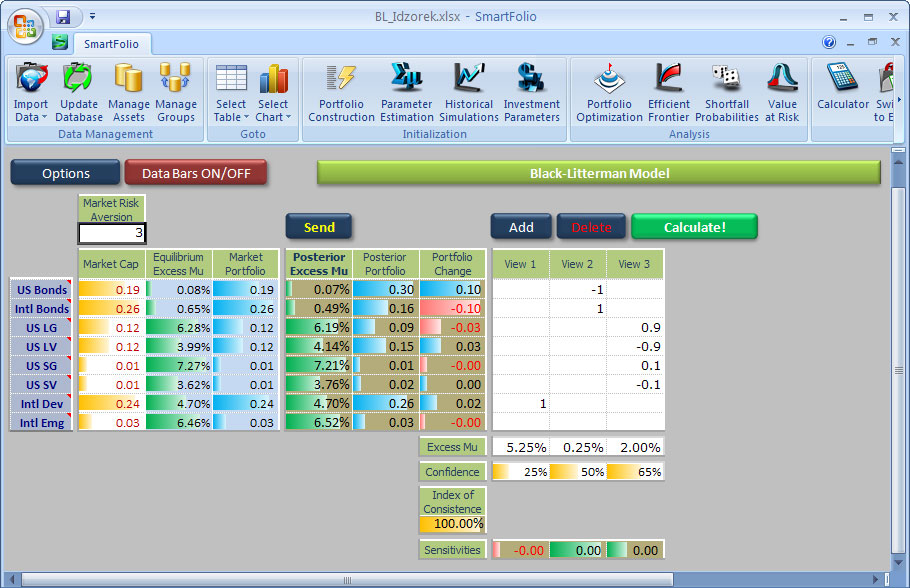
Market Risk Aversion - risk aversion coefficient peculiar to the market as a whole. According to research this figure is around 3.
Market Cap - market capitalization measured in arbitrary, yet common units.
Equilibrium Excess Mu - values of the Excess Mu vector implied by the market equilibrium.
Market Portfolio - market portfolio values are equal to the corresponding market capitalizations normalized in such a way that final values sum to 1.
Posterior Excess Mu - vector of posterior expected excess returns, which is obtained as a blended mix of prior excess returns (Equilibrium Excess Mu) and investor's subjective views. This is the main result of the Black-Litterman algorithm.
Posterior Portfolio - vector of Merton Portfolio weights corresponding to Posterior Excess Mu and Market Risk Aversion.
Portfolio Change - the difference between Posterior Portfolio and Market Portfolio.
View 1, View 2,... - each column in this matrix together with the corresponding component of the Excess Mu vector describes a particular investor's view.
Excess Mu - vector of subjective expected excess returns for each view.
Confidence - depending on the settings in the Black-Litterman options dialog this is either a scalar or a vector. In the former case the value defines investor's global confidence in his/her views; in the latter case the investor is able to set confidence levels individually for each view. In both cases confidence levels are represented with numbers in the range from 0% to 100%.
Index of Consistence - statistics that measures the distance between prior returns and posterior returns (market implied returns and Black-Litterman returns). This value is always between 0% to 100%. Intuitively, the higher is the index, the higher is the consistence between the market model and the Black-Litterman expected returns.
Sensitivities - these are the sensitivities of the Index of Consistence to changes in the components of Excess Mu. The higher is the corresponding sensitivity, the higher is the influence of the corresponding view on the Index of Consistence.
Options - opens the dialog where you can select the way in which confidence of views is defined.
Data Bars ON/OFF - turns on/off incell databars.
Send - copies Posterior Mu to the corresponding place in the MODEL table.
Add - adds a view
Delete - deletes the view corresponding to the cell selected.
Calculate! - performs all necessary model calculations.